

A marketing dashboard is a marketing tool that can be used to present all website traffic and key figures and results for marketing channels in a single view. Marketing actions are made visually visible on a marketing dashboard according to the MRACE® model which facilitates marketing management and budgeting, among other things.
In this blog, I will discuss things like what a marketing dashboard is, how your business can benefit from the dashboard, and how to build a dashboard.
Table of Contents
1. Measuring marketing
Marketing measurement is the basis of digital marketing as a whole, and it is worthwhile to integrate it strongly into the processes as early as possible. This does not lead to a situation where some data is badly needed, but it is not available.
If the measurement is not planned and the most important indicators are not defined, the marketing dashboard is no use either. It is important to draw attention to the fact that the metrics to be measured are defined through business objectives. Data is no use if you cannot dig up the answers to the most relevant questions for your business. In the beginning, we need to map out what goals the company has and based on it we can form questions that we would like to find answers to in the data. Therefore, also with SDM, the construction of the Dashboard starts with the creation of a measurement strategy. Nice-to-know metrics can be thought of at a point when the most relevant metrics for business already exist.
When measuring marketing, it is important to take care of the cleanliness of your data – that it is complete and can be trusted. If the technical implementation of the measurement is not in order (for example, not all campaign traffic is marked or conversions are not configured or incorrectly configured), the error will recur quickly. We make incorrect analyses and assumptions about the data and, on that basis, make incorrect actions. It is therefore imperative that the base is in order before proceeding with the data visualization, i.e. the construction of the actual dashboard.
We have developed a measuring frame to guide our and our customers’ work. Our marketing measurement process consists of 6 points:
-
-
- Assessment of the current state
- Measurement strategy
- Technical implementation
- Reporting and data visualization
- Analysis and optimization
- Business development
-
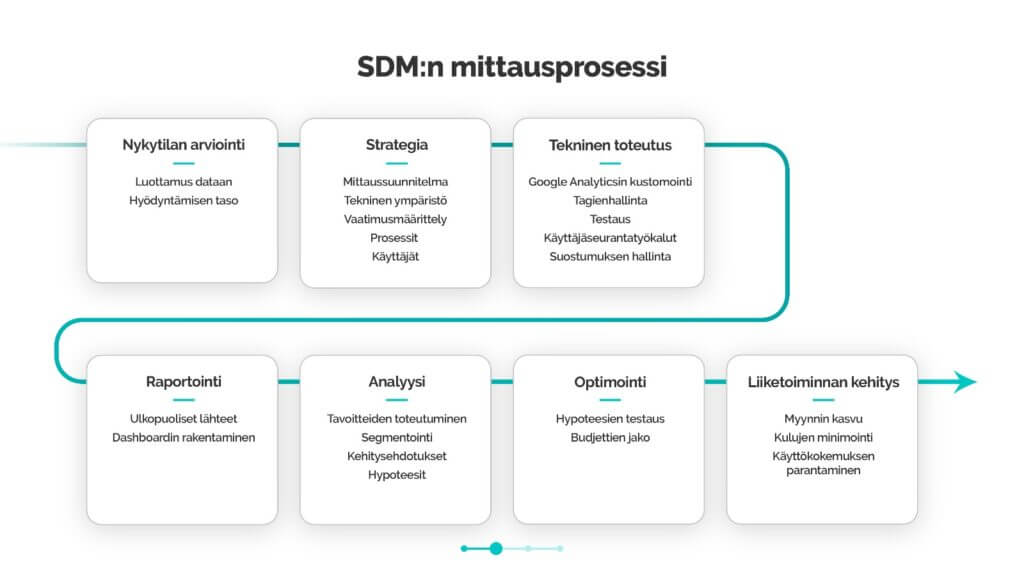
Read more about the topic: Measuring marketing as a process
From the marketer’s point of view, the challenge for measuring marketing is set by the EU’s General Data Protection Regulation (GDPR) and increasingly strict cookie practices. When collecting data, you must ensure that it is done with GDPR in mind. GDPR requires your company to inform the user who comes to the website about the cookies in use, what they are used for and how long they are valid.
In the data analysis phase, the challenges and limitations of measurement should be kept clear. For example, browsers have tightened their own cookie policy over the years. These factors further highlight the fact that analytics does not tell absolute truths but is intended more to track trends.
2. What is a marketing dashboard?
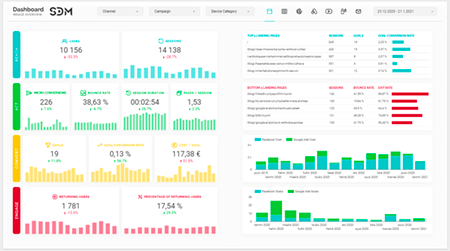
The marketing dashboard is a tool for every modern marketer. The dashboard provides the marketer with the ability to track marketing figures almost in real time in a visual, easy-to-interpret format. The dashboard helps you to understand the impact of the marketing measures and the overall ROI of marketing.
We use the Google Data Studio , a Google-provided tool for visualizing data, in the background of the MRACE® Dashboard. With various connectors, it is possible to connect almost any structured source of data – starting with a simple Excel table to CRM systems. The dashboard provides all of the necessary data in one place, and you can use your own browser to explore what is happening on your company’s website and marketing phases of the MRACE® model.
3. The top 6 benefits of a marketing dashboard
Deploying a marketing dashboard brings many benefits and solves the marketer’s everyday challenges.
Real data available in one place – you save time and focus on the essentials
When digital marketing is done in a versatile and multichannel way, marketing data is fragmented into different marketing platforms. There may be Google Ads, Facebook as well as quite a number of other ad networks, as well as e-mail marketing, for example. You will probably get a number of reports that tell you about the key figures for each platform. The reports come once a month or weekly and contain information generated by that platform, such as clicks, impressions, and conversions. Based on these, it is difficult to form an overall picture of the website’s traffic and the sales or leads it imports. The marketing dashboard brings the information together in an easily interpretable format in one place.
Often, the marketer also needs to report the impact of marketing measures to other stakeholders, such as the management team. Time-consuming manual work is eliminated when you do not have to manually assemble chapters from different marketing channels in One PowerPoint or Excel, but everything is displayed in the dashboard. You can use the time saved from provisioning and collecting numbers to analyze data and plan the following actions, for example.
Decision-making is accelerated because the data is available almost in real time
Decision-making is accelerated because the data is updated almost in real time – you no longer have to wait for the monthly report of the previous month, but you focus heavily on the future. Even quick actions can be taken agilely, because the effectiveness of the actions taken or ongoing campaigns can be assessed immediately.
You know the roles of the marketing channels in your customer’s purchase process
Each marketing channel has a role to play in its entirety: some channels serve more strongly in the early stages of the purchase process and act more as prospective channels – for example, raising awareness and bringing new customer flow to the site. Some of the channels, on the other hand, work better at the end of the purchase process and are so-called clustering channels and bring more direct euros to the table.
It is worth remembering that although very often organic and paid brand traffic (the keyword has included a brand term) or direct traffic seems to bring all conversions. However, from somewhere, these customers have ended up on your company’s website – very often through a channel that works more strongly at the top of the purchase process, such as unbranded search traffic or, for example, social media marketing. The dashboard helps you outline what stage of the buying process each of the channels will serve. At the same time, comparing the results of marketing channels is made easier when channel-specific figures are displayed in the same view in the dashboard.
Yest also: Attribution modelling: Enter a value from conversions for the channels to which it belongs
Easy marketing budgeting and budget allocation
When you identify the roles of the marketing channels in the purchasing process, the marketing budget planning and budget allocation are made much easier.
With the dashboard, you follow marketing ROI as a whole in addition to the profitability of marketing channels. When the costs and results are clearly visible, you ensure that you direct your marketing euros to the right channels with the right investments in accordance with the current goals.
Different perspectives provide the necessary information for different stakeholders
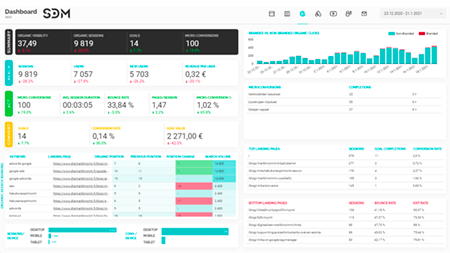
Different user groups need different key figures. The management team is often interested in the big picture, while the marketing team wants to focus more deeply on the functionality of a single campaign and its ads. Therefore, multiple views are built into the marketing dashboard:
-
-
- A comprehensive Management overview, that gives you a glimpse of the key figures, costs, and results for the various MRACE® model steps
- Marketing Channel Summary View, from which you can easily compare the results of the different marketing channels and identify which marketing channels serve at which stages of the MRACE® model – this will help you better understand your customers’ purchasing process
- Marketing channel views, including Google Ads and social media advertising. In these views, you can dive deeper into the data of a particular marketing channel and view it in detail down to the keyword and ad level.
-
Different views and filters built into the dashboard allow you to view, for example, the performance of a specific quotation campaign as a whole, taking into account all marketing channels instead of trying to form an overview based on reports from the individual channels. You can also change the period under review with a single click and compare the figures with either the previous period, the corresponding period last year, or any other desired time attribute.
Not just a reporting tool, but it also directs the development measures
The marketing dashboard is not only intended for reporting, but it is also a tool for marketing development. Multifunctional views and filters allow you to learn about things like:
-
-
- Find bottlenecks that could potentially cause you to lose potential customers
- See which landing pages are most popular and which need development
- See which user groups buy from you the most and from which channels
-
The ability to segment the data displayed in the dashboard ensures that you can dig up answers to questions that concern you and be able to prioritize development measures so that you first start developing the things that are most important to the whole. Dashboard makes decision-making truly data-driven.
With the dashboard, you are constantly aware of what is happening on your website and marketing at different stages of the MRACE® model. In the future, you will be able to lead your marketing so that it genuinely takes you towards your business goals and directs your marketing euros to where they bring the best results.
4. Building a marketing dashboard – how is the project going?
When we build a marketing Dashboard based on the MRACE® model, we move forward from the marketing measurement process from the current status assessment to the measurement strategy, from technical implementation and finally to data visualization.
We will start with the current situation and the mapping of current marketing activities. We look at what data is currently available and assess the reliability of the current data. The next step is to make a measurement strategy. The end result is a measurement plan based on your company’s business objectives, which transforms the goals into indicators and KPEs according to the different phases of the MRACE® model. At the same time, a technical environment is defined in which action is taken. We match the measurement plan with the realities. Overall, account is taken of who use analytics and what information they need.
The technical implementation covers the installation of the analytics tool (Google Analytics) and its customization according to the best practices. We also take care of tag management (defining and naming the necessary triggers and tags in Google Tag Manager). Technical implementation is carried out while taking GDPR into account.
When the so-called work under the hood has been done, we can switch to data visualization, i.e. building the actual dashboard. The dashboard builds the necessary views and the meters and KPIs specified in the measurement plan are visualized. We use our own base according to our MRACE® model. Once the project is complete, we will help you deploy the dashboard in the form of user training.
5. Analyze data using a dashboard
The numbers alone in the dashboard do not yet help you to develop your business, but you also need to be able to interpret the data collected. Insights generated through data analysis. The visual Dashboard contributes to the interpretation of the figures and is also easier to understand for people who may not have in-depth marketing skills.
If you are going to do a marketing dashboard with us, we will assist you in analyzing the data in the future. You can learn, among other things, what kind of marketing measures you should take, what measures you should test, and how to develop your website to better meet your customers’ needs. We also ensure that the data is reliable and can be used to make business decisions now and in the future.
6. Summary
The visual marketing dashboard replaces the static PDF and Excel reports and brings agility to the planning and implementation of marketing activities. The manual work of reporting is eliminated when all marketing data is available in one place. The dashboard also provides an opportunity to dig up development sites and facilitate the prioritisation of development measures.
Want to start developing web analytics and deploying a marketing dashboard? Read more about our web analytics service!


